Portable Measurement and Control System PFT4A-2S-2P
Portable Data Acquisition System V1.0 - User Operation Manual
1. System Overview
This system is a multi-functional data acquisition and control platform based on an industrial-grade HMI (Human-Machine Interface). The system communicates with multiple external hardware modules through the efficient Modbus RTU (RS485) protocol to achieve real-time monitoring, calculation, and display of analog signals, multi-channel temperature, and high-speed pulse signals, and it features flexible manual and automatic relay control capabilities.
Core Hardware Integration:
- Multi-function AIO Module (Slave 1): Responsible for 4 channels of analog signal input and 3 channels of relay output.
- 2-Channel Temperature Acquisition Module (Slave 2): Responsible for data acquisition from up to 2 PT100/PT1000 temperature sensors.
- High-Speed Pulse Acquisition Module (Slave 3): Responsible for hardware counting of 2 channels of incremental pulse signals, used for flow, speed, or 1 channel of angle measurement.
This manual will provide a detailed introduction to the system's functions, operation methods, performance characteristics, and precautions.

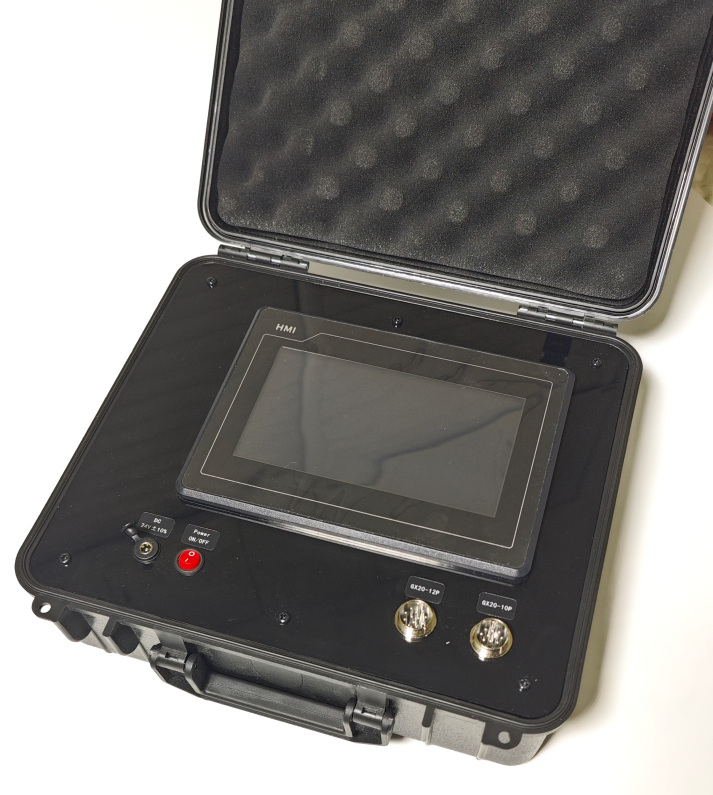
1.2 Layout Introduction
| No. | Name | Description |
|---|---|---|
| 1 | Power Supply Port | DC12V |
| 2 | Power Switch | System main switch |
| 3 | Battery Level Display Area | |
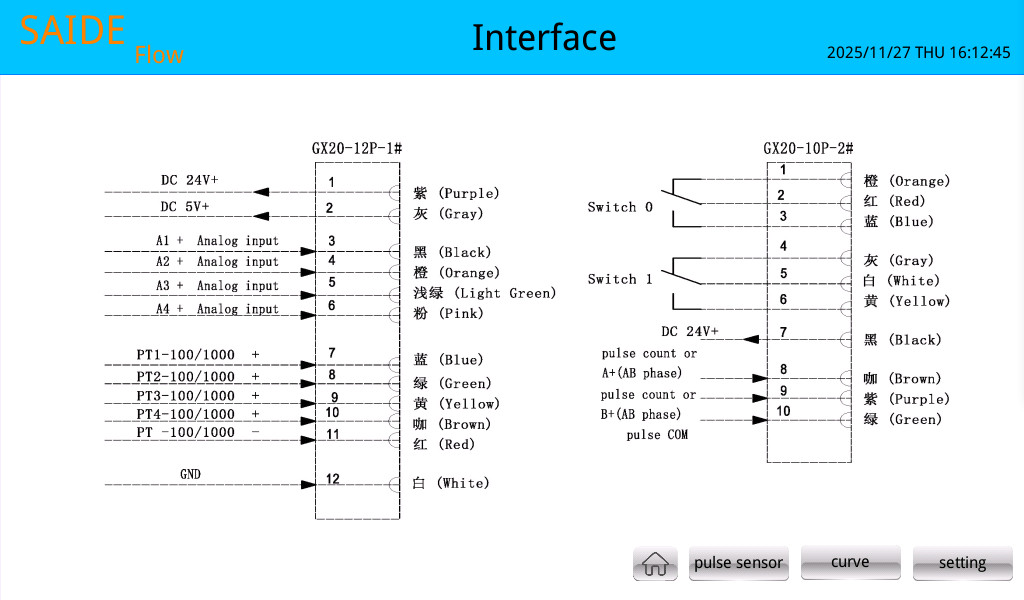
| 4 | GX20-12P Aviation Connector | See section 4.6 for definition |
| 5 | GX20-10P Aviation Connector | See section 4.6 for definition |
| 6 | Touchscreen | / |
2. System Core Features
-
Real-time Data Display: Clearly and intuitively displays all key data.
-
Full Parameterization: All sensor ranges, types, names, units, as well as relay control parameters and pulse K-factors can be freely set on the interface, and modifications take effect immediately without a restart.
-
Intelligent Polling Mechanism: The system can automatically identify the current operating interface and poll relevant devices on demand. For example, on the main interface, the system will concentrate resources to refresh analog and temperature data at high speed; when switching to the pulse interface, it will focus on refreshing flow and speed, greatly improving data response speed and bus efficiency.
-
Flexible Relay Control: Supports immediate manual control, as well as fully automatic cycle control where the number of cycles, on-time, and off-time can be set.
-
Precise Pulse Processing: Integrates professional pulse acquisition algorithms, including counter rollover (overflow) handling and dynamic weighted average filtering, to ensure stable and accurate flow and speed readings under various working conditions.
-
Dynamic Curve Monitoring: Supports real-time data curve plotting and allows users to dynamically adjust the Y-axis display range during runtime to facilitate observation of data details.
3. Main Parameters
Model: PFT4A-2S-2P
Dimensions:305X295X130 mm
Weight:2.39 kg
Power Supply: DC12V
Power:5W
Internal Battery: 12V DC 6000mAh
Output: 12V DC
Touch Screen Size: 7 inches
3.1 Analog Signal Acquisition
Analog Acquisition: 4 channels
Response Time: 200ms
Acquisition Accuracy: ±0.1%
Supported Analog Signals:
| Voltage Signal | Current Signal |
|---|---|
| 0-10V; 1-5V; 0-5V; 0.5-4.5V;1-4.8V | 0-20mA; 4-20mA |
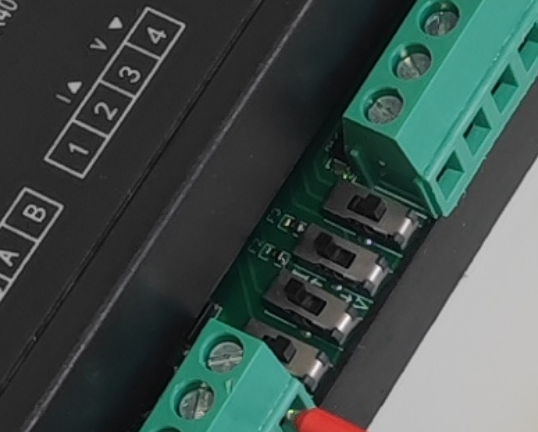
Note:
When switching between voltage and current signals, internal hardware switches inside the case need to be manually adjusted. Follow the direction of the arrow on the label.
Default Configuration: Channels 1, 2are for voltage signals, and Channel 3 ,4 is for current signals.
Curve Display: Minimum acquisition resolution 100ms
3.2 Relay Control
Number of Relays: 3 groups
Relay Capacity: 250VAC 5A
Control Mode: Manual / Timed Cycle
3.3 Thermal Resistor Acquisition
Thermal Resistor Type: PT100, PT1000
Thermal Resistor Acquisition: 2 channels
Note:
All 2 channels must be either PT100 or all PT1000.
3.4 Pulse Signal Acquisition
Pulse Count Acquisition: 2 channels
Angle Acquisition: 1 channel (Encoder AB phase)
Note:
Count acquisition and angle acquisition cannot be used simultaneously.
Maximum Hardware Acquisition Frequency: 40KHz
Polling Time: 1s
Angle Measurement: 0-360° cycle or Incremental display
4. Interface and Function Details
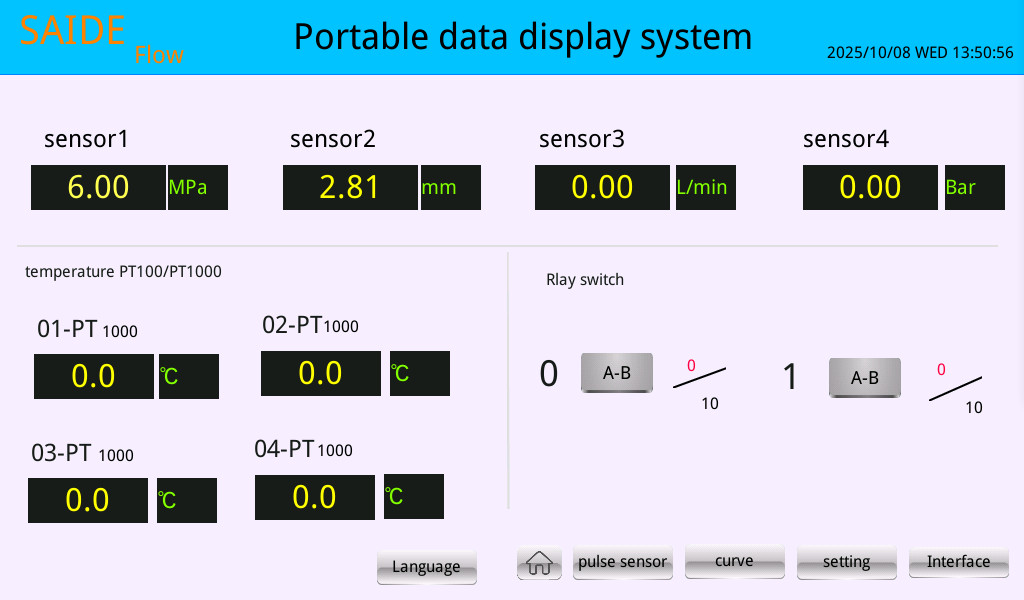
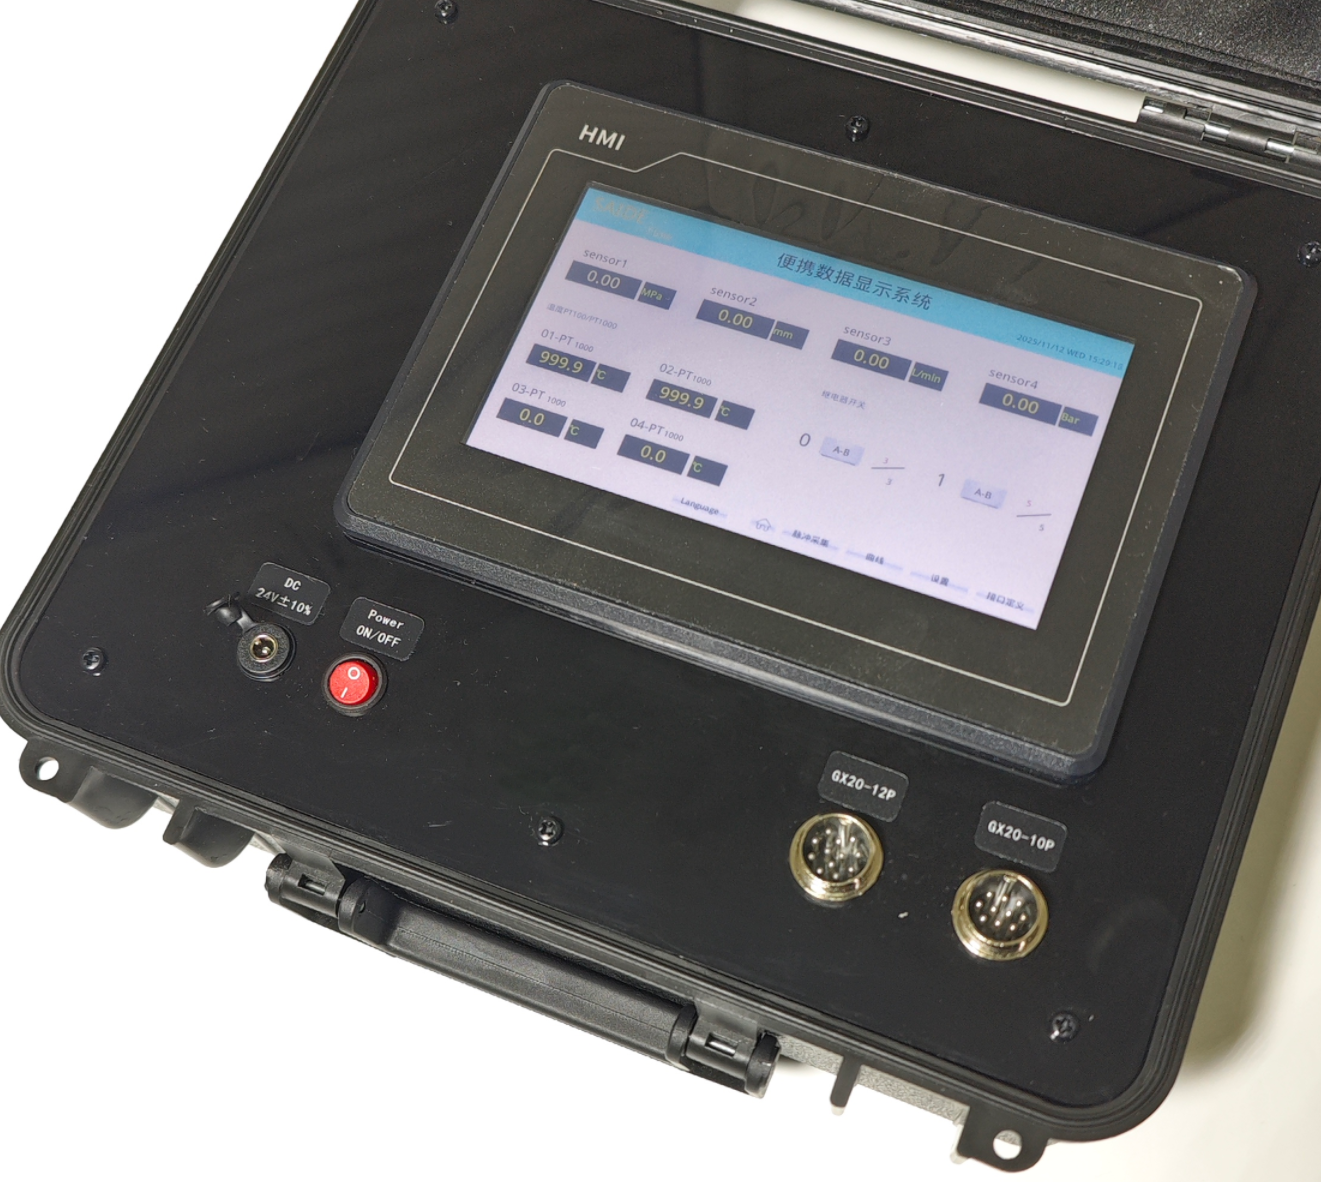
4.1 Main Interface (Data Acquisition System)
This is the system's core monitoring page, displaying the most critical real-time data.
-
Analog Display Area: The top section shows the current physical values, names, and units for the 4 analog channels. Supported analog types: 0-10V; 0-20mA; 1-4.8V; 1-5V; 0-5V; 0.5-4.5V;4-20mA.
-
Temperature Display Area: The lower-left area displays the real-time temperature values for up to 4 temperature channels. Supports PT100 and PT1000.
-
Relay Manual Control Area: The lower-right area displays the manual control panel for up to 3 relays.
- Click the A-B button to directly switch the on/off state of the corresponding relay.
- The
0/10indicator lights show the status of the relay's automatic cycle settings in real-time (0 = number of cycles completed, 10 = total number of cycles set).
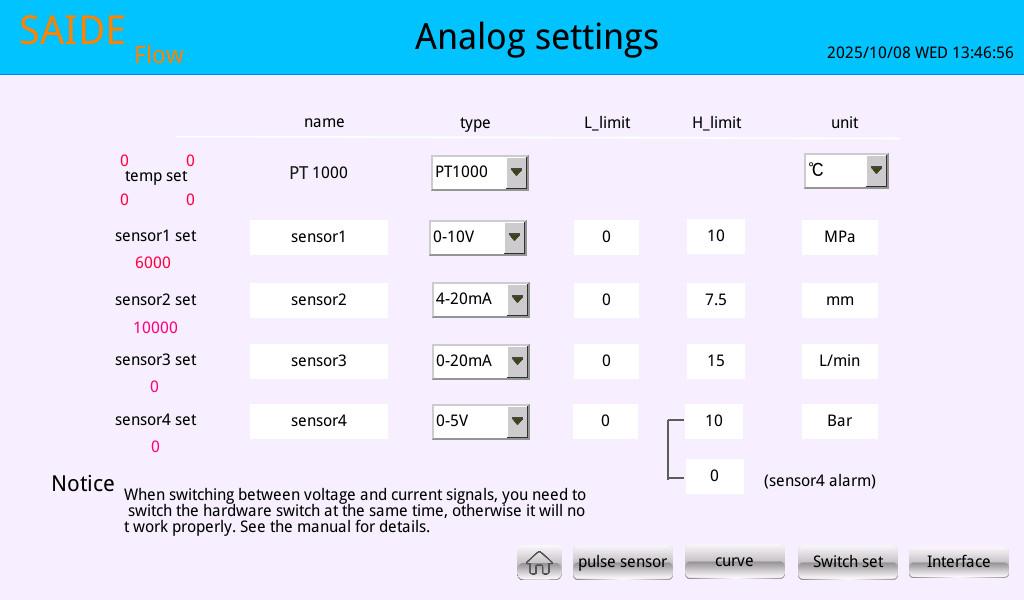
4.2 Analog Parameter Setting Interface
This page is used to configure the core parameters for all analog and temperature sensors.
-
Usage:
- name: Click the text box to enter a custom sensor name (e.g., "Inlet Pressure").
- type: Click the drop-down box to select the actual signal type of the sensor (e.g.,
0-10V,4-20mA, etc.). The system will automatically configure the hardware module based on your selection. - L_limit / H_limit: Click the number box to enter the lower and upper limits of the sensor's corresponding physical range.
- unit: Click the text box to enter a custom unit for the physical quantity. This is only for text display on the home page.
- sensor4 alarm is an alarm function. When the value is greater than the set value, the value on the home page will flash red as a reminder. Only channel 4 supports this function.
-
Important Reminder: Using the default parameters, channels 1, 2are set for voltage signals, and channel 3,4 is for current signals.
-
If the user wants to switch between voltage and current signals, they need to manually open the data case and toggle the switch position as indicated by the arrow to ensure proper operation.
4.3 Relay Parameter Setting Interface
This page is used to set the control mode and parameters of the relay.
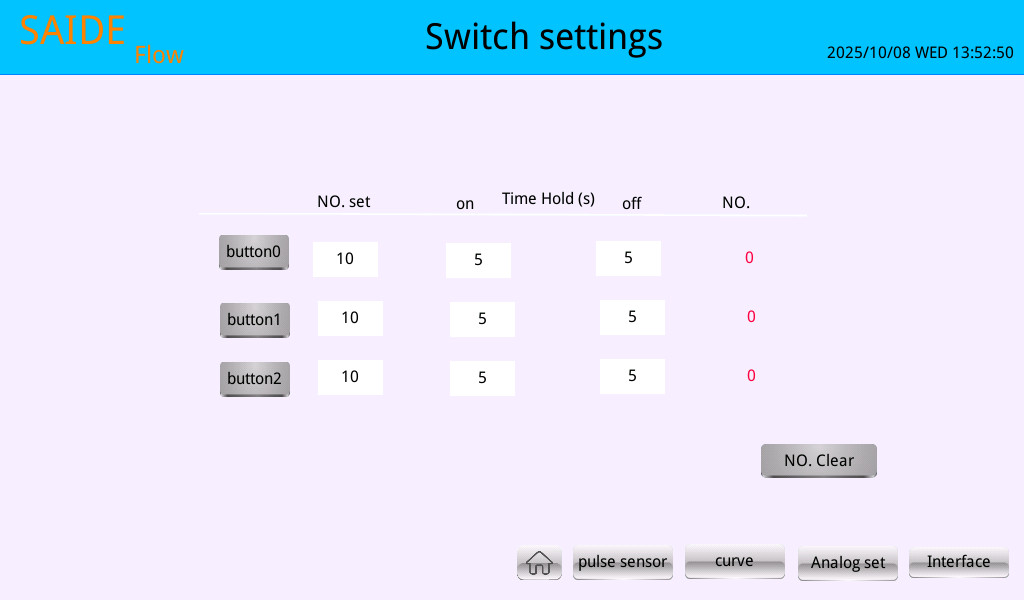
Relay modes include: Normal Mode, Momentary Mode, Cycle Mode, and Linkage Mode.
Normal Mode: Manually click the button, and the relay switches on or off according to the manual action.
Jog Mode: Manually click the button once, and the relay automatically turns off after the delay time set.
Cycle Mode: The relay executes commands according to the set number of cycles, On-position wait time, and Off-position wait time. It automatically stops after reaching the set number of cycles, and the switch count must be manually cleared before the next action can be performed.
- Usage:
- NO. set: Sets the target total number of automatic cycles.
- on Time Hold (s): Sets the hold time for each energized (ON) state of the relay, in seconds.
- off Time Hold (s): Sets the hold time for each de-energized (OFF) state of the relay, in seconds.
- NO.: Displays the current number of completed cycles in real time.
- button1-3: After setting the parameters, directly click the corresponding button on the current page to start or stop the automatic cycle.
- Clear Switch Count: Clicking this button will reset the "NO." (operating count) for all relays to zero.
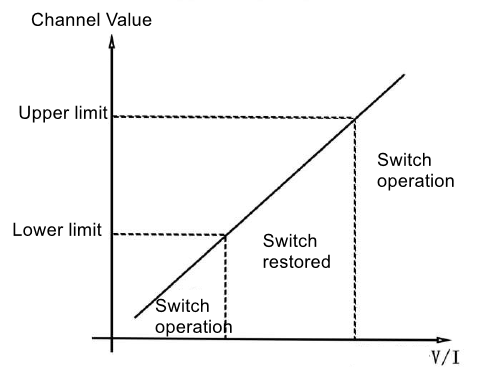
Linkage Mode: Relays 1-3 correspond to analog sensors 1-3. After setting the corresponding lower and upper limits on the relay settings page, the relay will execute an action if the value falls outside this range. A delay execution time can be set afterwards. Refer to the diagram for relay action logic:
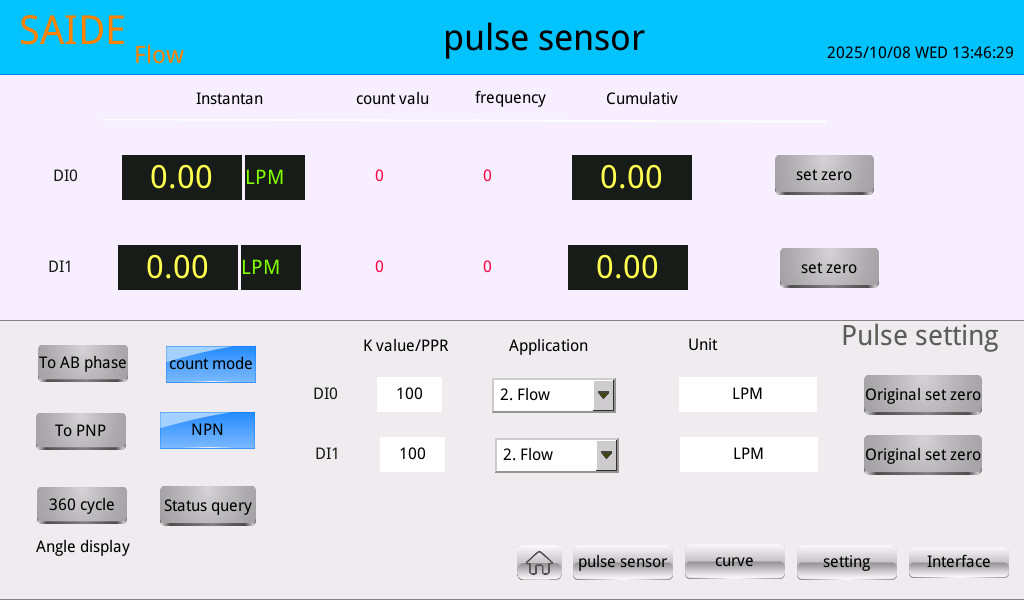
4.4 Pulse Acquisition Interface
This page is specially designed for flow and speed monitoring, providing detailed parameter settings and data display.
-
Data Display:
- Instantaneous Value: Displays the real-time value after filtering and calculation.
- Cumulative Value: Mainly used to display the cumulative flow value in flow measurement applications.
- Small red numbers: Display the raw count or pulse count value read directly from the hardware module in real-time, used for debugging. You can also use it to check the pulse count.
- Zeroing: In flow applications, this resets the cumulative flow. In angle applications, this sets the initial zero point.
-
Parameter Settings:
- Kvalue/PPR: For the application context, when speed is selected, this is the Speed K-factor. Its physical meaning is "the number of pulses generated by the sensor for one revolution of the motor/equipment," i.e., PPR (Pulses Per Revolution). When flow is selected, enter the Flow_K: Flow K-factor. Its physical meaning is "the number of pulses generated by the sensor for each unit volume (e.g., liter/L) of liquid that flows through." When the working mode is set to AB phase for angle applications, enter the encoder's pulses per revolution here.
- Application: When the working mode is AB phase, this option is "Angle". When the working mode is "count mode", you can select: Count, Flow, or Speed.
- Unit Definition: When switching the application context, the system provides a default parameter, which the user can modify.
- Reset Raw Value: Resets the hardware counter to zero.
-
Operation Buttons:
- To AB phase/ To count: Switch the working mode. Select "AB phase" for angle measurement with an AB phase encoder; select "count" for counting, flow, or speed.
- To PNP/NPN: Select the signal type.
- 360Cycle/Incremental: The display mode for angle measurement: 0-360° cycle or incremental display (accumulated angle).
Key Points:
The pulse signal voltage must not be lower than 3.3V.
Count mode and AB phase mode cannot be used simultaneously.
4.5 Curve Viewing Interface
This page is used to display the data from up to 4 analog channels as real-time curves.
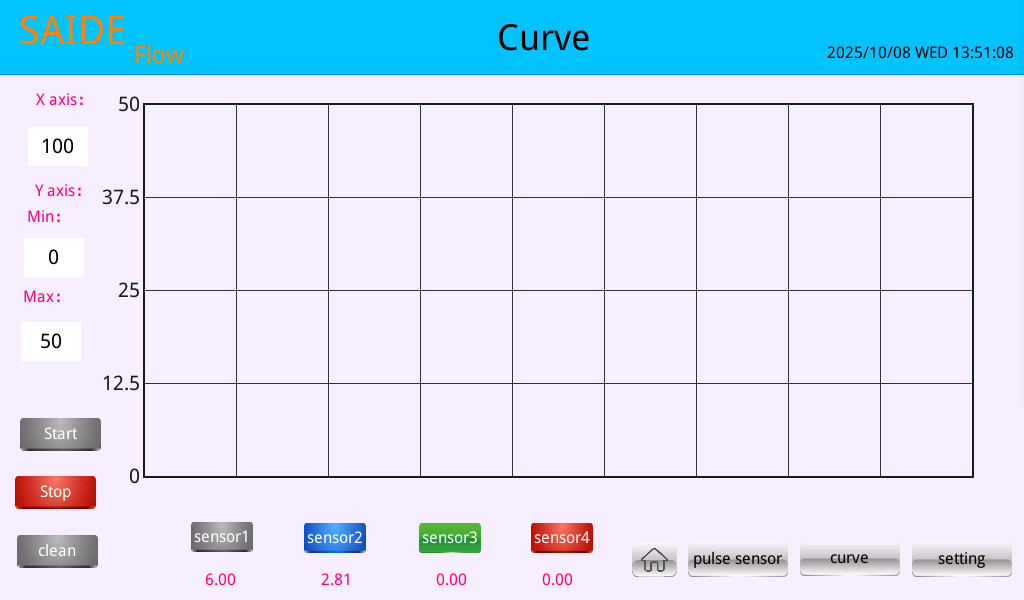
- Usage:
- Channel Selection: Click the
sensor1~sensor4buttons at the bottom to hide or show the corresponding channel's data on the curve. - Y axis Min/Max: Click the value boxes on the left to dynamically modify the lower and upper limits of the curve's Y-axis display range. This is very useful for observing small fluctuations or signals that include negative values.
- X axis: Modify the display span of the X-axis to better observe curve changes.
- Start/Stop/Clean: Control the starting, pausing, and clearing of the curve.
- Channel Selection: Click the
4.6 Wiring Description Interface
Provides hardware wiring diagrams and pin definitions for the aviation connectors to facilitate on-site installation and maintenance.
4.7 Language Display Switching
Supports switching between Chinese and English.

5. Usage and Precautions
Wiring Examples:
Analog Sensor Connection:
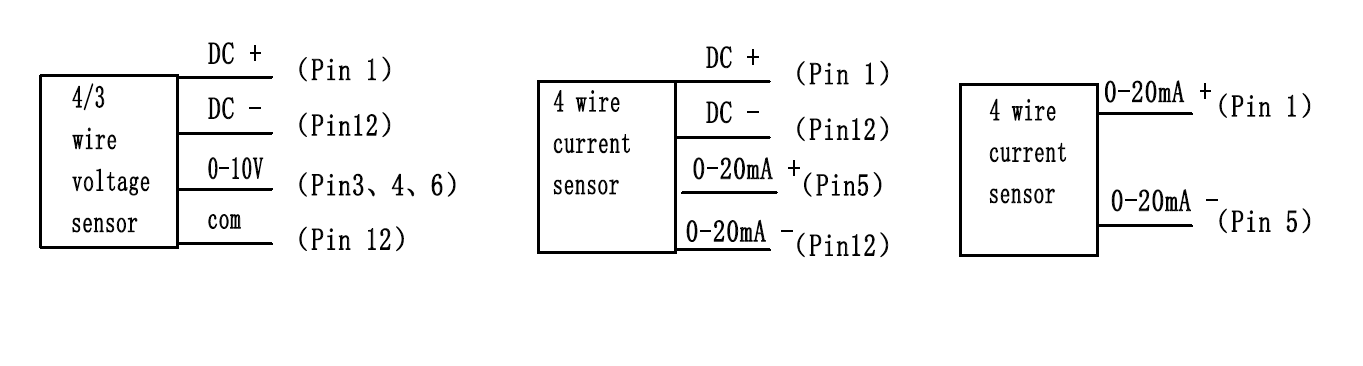
Note: If you are using your own external power supply, the GNDs need to be connected together.
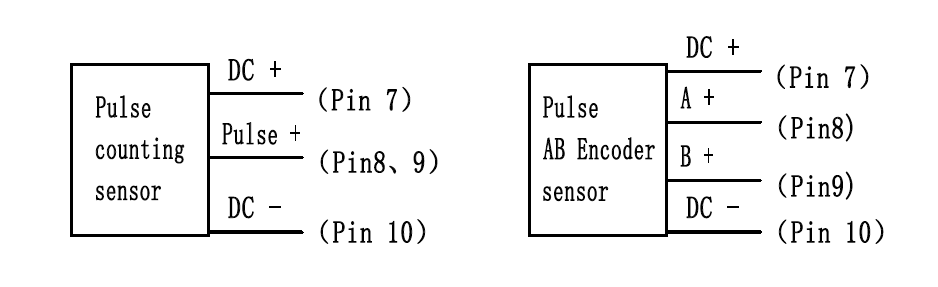
Pulse Sensor Connection:
PT100 or PT1000 Connection
Can connect to 2-wire, 3-wire, or 4-wire RTDs. Connect by grouping the wires according to color.
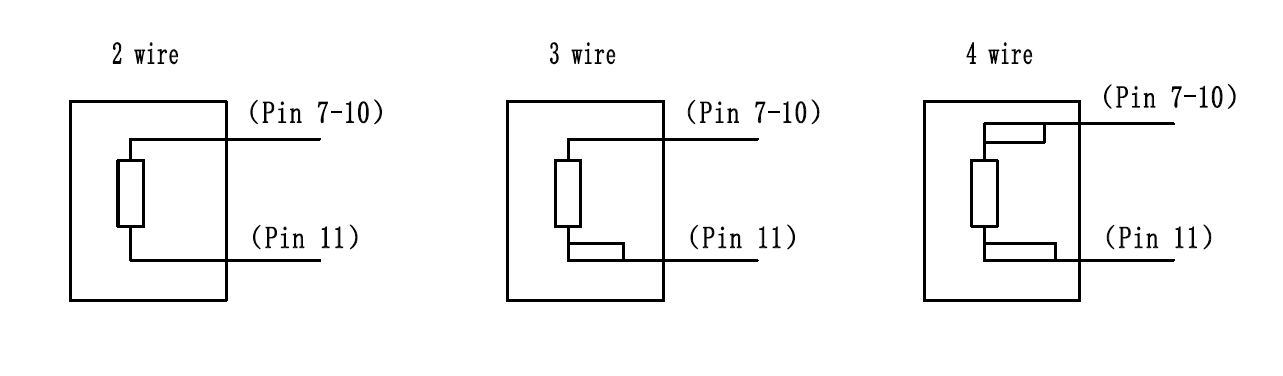
Note
Every 10m of wire will introduce about 1.4 ohms of resistance per single wire. For a PT100, a resistance change of about 0.38 ohms corresponds to a 1°C temperature change. Therefore, for every 10 meters, two wires will cause the measured temperature of a PT100 to be about 7.3°C higher. The effect on a PT1000 is 10 times smaller. When the wiring is long, it is recommended to use a PT1000.
6. Appendix:
This system uses the Modbus RTU 485 protocol for communication.
- Slave 1: AIO Module (4 analog inputs, 4 relay outputs)
- Slave 2: 2-Channel Temperature Acquisition Module
- Slave 3: High-Speed Pulse Acquisition Module
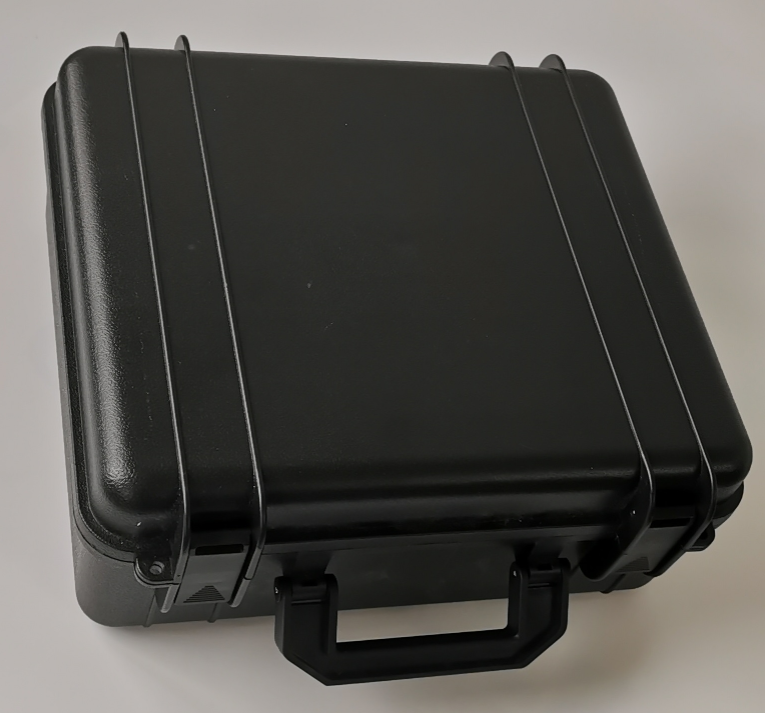
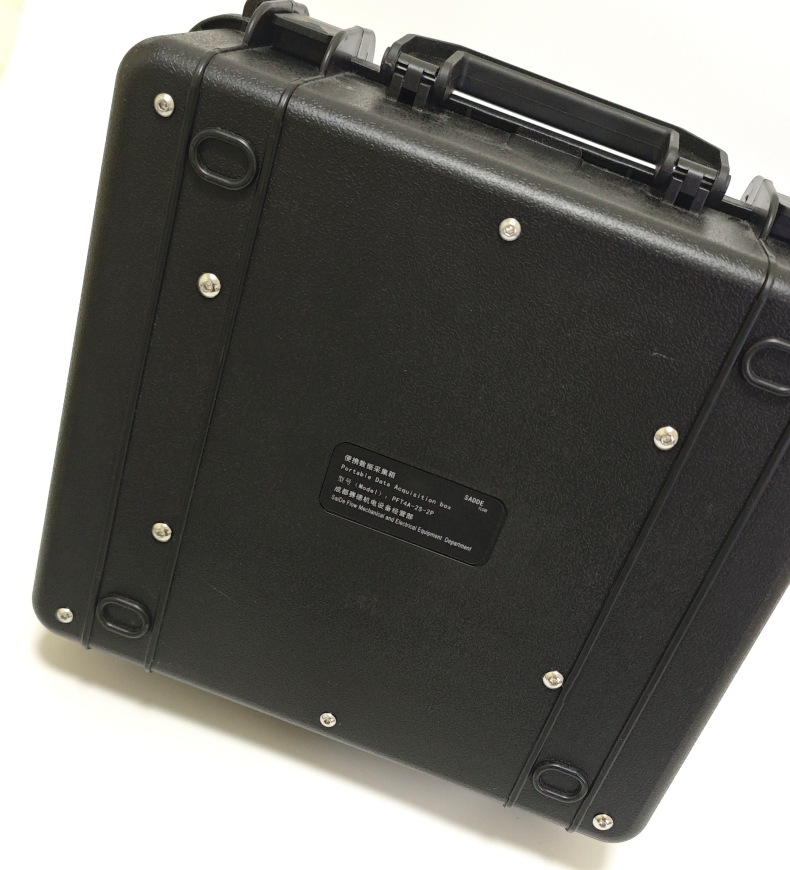
7.Physical Pictures
 |
 |
 |
|---|---|---|
 |